
Global CO2 Emissions
This project showcases data visualization techniques using Tableau to explore global carbon dioxide emissions. The interactive dashboard allows users to analyze CO2 emissions by country and year, providing insights, trends, and comparisons.
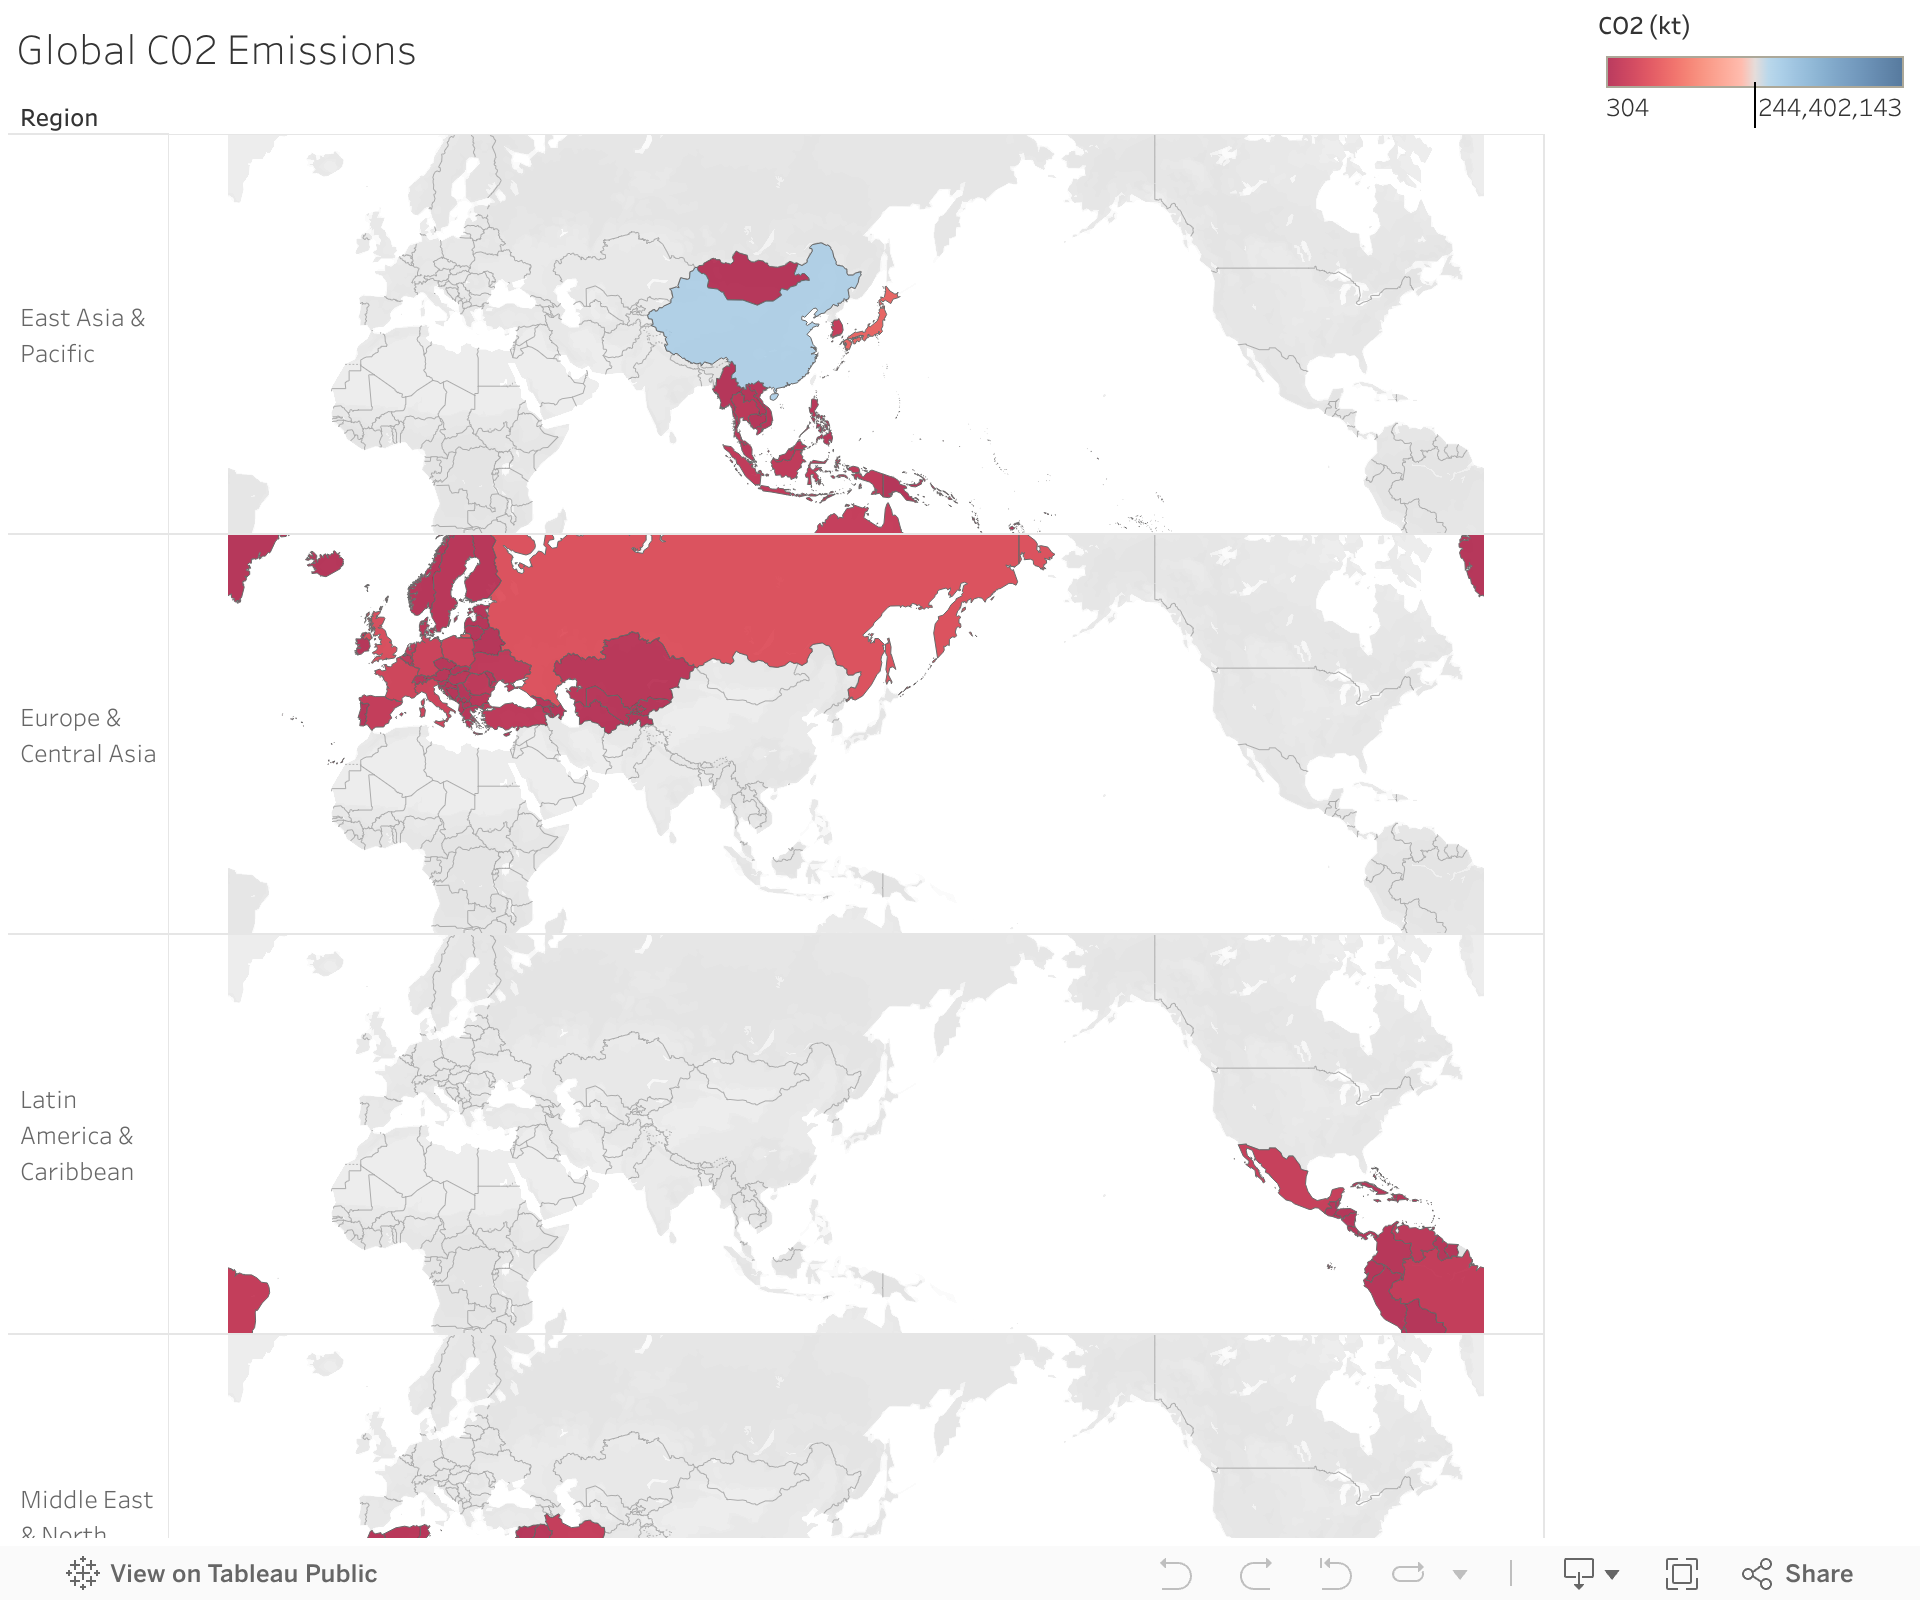
Please watch my demo video below. If you would like to view the entire dashboard or if the embedded dashboard isn’t working properly, please visit through Tableau Public.
Dataset Source
Provided by the Google Data Analytics Professoinal Certificate Program on Coursera.